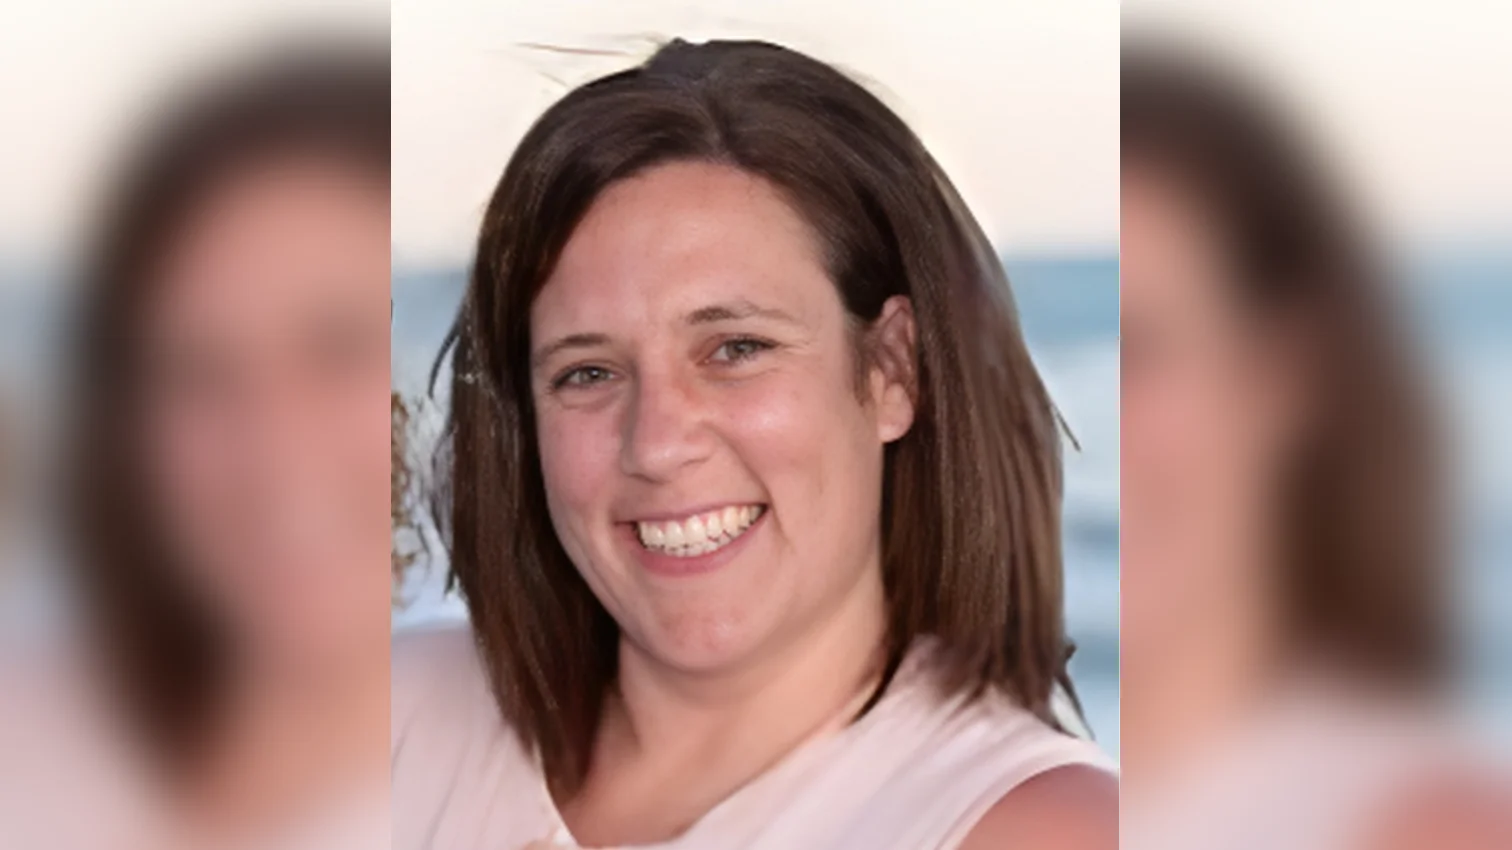
Assistant Principal Melissa Frankel | Official Website
Assistant Principal Melissa Frankel | Official Website
Of the 15,609 students attending DeKalb County schools, 59.9% were white. Hispanic students were the second largest ethnicity, making up 21.7% of DeKalb County students.
In the previous school year, white students were also the most common group in DeKalb County, representing 60.2% of the student body.
Jefferson Elementary School had the most even distribution of races among county schools, including 35.7% white students, 31.7% African American students, 19.4% Hispanic students, 9.1% multiracial students, and 4.1% Asian students.
The Illinois State Board of Education’s budget for fiscal year 2026 will increase from nearly $10.8 billion to about $11.2 billion. This includes a $307 million boost for K–12 schools, marking the smallest annual increase since 2020.
The agency has paused about $50 million in funding previously allocated through the Evidence-Based Funding formula for the Property Tax Relief Grant while reviewing its impact on local tax relief. Officials say the pause could affect the timing and amount of property tax relief available to taxpayers.
| School name | Most prevalent ethnicity | Percent of Total Student Body | Total Enrollment |
|---|---|---|---|
| Clinton Rosette Middle School | Hispanic | 38.7% | 568 |
| Cortland Elementary School | Hispanic | 41.5% | 504 |
| Dekalb High School | White | 37.3% | 1,936 |
| Founders Elementary School | Hispanic | 40.6% | 542 |
| Genoa Elementary School | White | 75.6% | 344 |
| Genoa-Kingston High School | White | 72.3% | 465 |
| Genoa-Kingston Middle School | White | 72.4% | 348 |
| Gwendolyn Brooks Elementary School | African American | 58.6% | 314 |
| Herman E. Dummer School | White | 77.8% | 252 |
| Hiawatha Elementary School Prek-5 | White | 81.4% | 215 |
| Hiawatha Junior/Senior High School | White | 80.2% | 202 |
| Hinckley-Big Rock Elementary School | White | 82.9% | 345 |
| Hinckley-Big Rock High School | White | 82% | 200 |
| Huntley Middle School | White | 36% | 876 |
| Indian Creek Elementary School | White | 84.5% | 251 |
| Indian Creek High School | White | 81.9% | 254 |
| Indian Creek Middle School | White | 78.8% | 222 |
| James R. Wood Elementary School | White | 83.6% | 298 |
| Jefferson Elementary School | White | 35.7% | 319 |
| Kingston Elementary School | White | 73.1% | 331 |
| Lincoln Elementary School | African American | 44.7% | 266 |
| Littlejohn Elementary School | Hispanic | 49.3% | 359 |
| Lynn G. Haskin Elementary School | White | 74.3% | 268 |
| Malta Elementary School | White | 43.5% | 285 |
| North Elementary School | White | 80.1% | 291 |
| North Grove Elementary School | White | 83.1% | 426 |
| Prairie View Elementary School | White | 86.8% | 189 |
| Sandwich Community High School | White | 75% | 531 |
| Sandwich Middle School | White | 73% | 423 |
| Somonauk High School | White | 84.8% | 223 |
| Somonauk Middle School | White | 82.4% | 238 |
| South Prairie Elementary School | White | 72.2% | 349 |
| Southeast Elementary School | White | 81.3% | 299 |
| Sycamore High School | White | 78% | 1,152 |
| Sycamore Middle School | White | 80.4% | 828 |
| Tyler Elementary School | African American | 53.7% | 283 |
| W.W. Woodbury Elementary School | White | 73.3% | 161 |
| West Elementary School | White | 62.3% | 252 |
Information in this story was obtained from the Illinois State Board of Education. The source data can be found here.


 Alerts Sign-up